

Ticket progress chart
Give a visual representation of the progress of a ticket
What is Ticket progress chart?
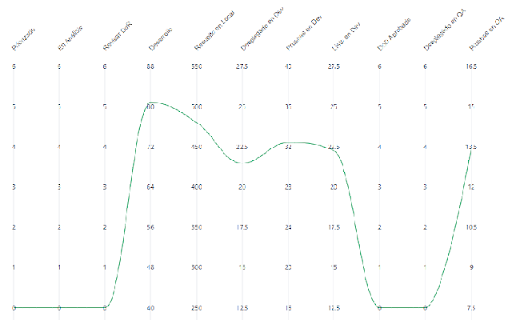
Ticket Progress Chart is a Chrome extension that offers a visual representation of ticket progress in JIRA. It displays the elapsed time by state, allowing you to easily track the progress of your tickets. Stay organized and informed with this convenient tool.

Stats
By:
jmorales0786
Users:
N/A
Creation date:
2023-06-22
Risk impact:
Low risk impact
Risk likelihood:
Moderate risk likelihood
Manifest version:
3
Size:
124.93K
Email:
jm*****@gmail.com
Stats date:
Chrome-Stats Rank
Other platforms
Not available on Firefox
Not available on Edge
Want to check extension ranking and stats more quickly for other Chrome extensions?
Install
Chrome-Stats extension
to view Chrome-Stats data as you browse the Chrome Web Store.

Summary
JIRA Issues graph to display the elapsed time by state
Safety
Risk impact
Ticket progress chart is relatively safe to use as it requires very minimum permissions.
Risk likelihood
Ticket progress chart is probably trust-worthy. Prefer other publishers if available. Exercise caution when installing this extension.
Upgrade to see risk analysis details
Screenshots
Similar extensions
Here are some Chrome extensions that are similar to Ticket progress chart:

https://scope360.se
285

hocgin
1,000+

DJP Dev
29

ethanhorowitz07
29

navhu
5

chacsr
616

https://fishies.me
106

KeithWatterson
11

devagamjot
6,000+

https://tempo.io
10,000+

robert.hettmansperger
970

kszksz
1,000+