Features & Capabilities

CAPE Dashboard puts four time-tested stock market valuation metrics at your fingertips, with historical data stretching back to 1871. How expensive is the stock market right now? Instead of guessing, check the data. CAPE Dashboard computes four complementary valuation indicators and shows where today's reading falls in over 150 years of market history. THE METRICS CAPE Ratio (Shiller P/E) — Developed by Nobel laureate Robert Shiller, the Cyclically Adjusted Price-to-Earnings ratio divides the S&P 500 by ten years of inflation-adjusted earnings. It smooths out short-term earnings swings and is one of the most widely cited long-term valuation measures. Trailing P/E — The classic price-to-earnings ratio using the most recent 12 months of reported earnings. More responsive to current conditions than CAPE, but also more volatile. Dividend Yield — Annual dividends paid by S&P 500 companies divided by the index price. One of the oldest and most reliable long-term return predictors. Buffett Indicator — Warren Buffett called it "probably the best single measure of where valuations stand." It compares total US stock market capitalization to GDP. Powered by Federal Reserve (FRED) data. FEATURES

Dashboard view with color-coded valuation bands for all four metrics Interactive historical charts for each metric — zoom from 10 years to the full 150+ year history Percentile rankings showing where today's values fall relative to all recorded history Key statistics: current value, historical median, mean, all-time highs and lows Educational content explaining each metric, what high and low readings mean, and important caveats Optional live price updates via Alpha Vantage (free API key, 25 requests/day) Home screen widgets (small and medium) for a quick glance at current valuations Dark mode support No account required — works immediately on launch

DATA SOURCES Historical data derived from Robert Shiller's publicly available dataset (Yale University), updated monthly. Buffett Indicator computed from Wilshire 5000 and GDP data via the Federal Reserve Bank of St. Louis (FRED). Optional live S&P 500 estimates via Alpha Vantage. This app is for informational and educational purposes only. It is not financial advice. Past valuations do not predict future returns. Not affiliated with or endorsed by Yale University, Robert J. Shiller, Barclays, or the Federal Reserve.

User Growth & Download Statistics
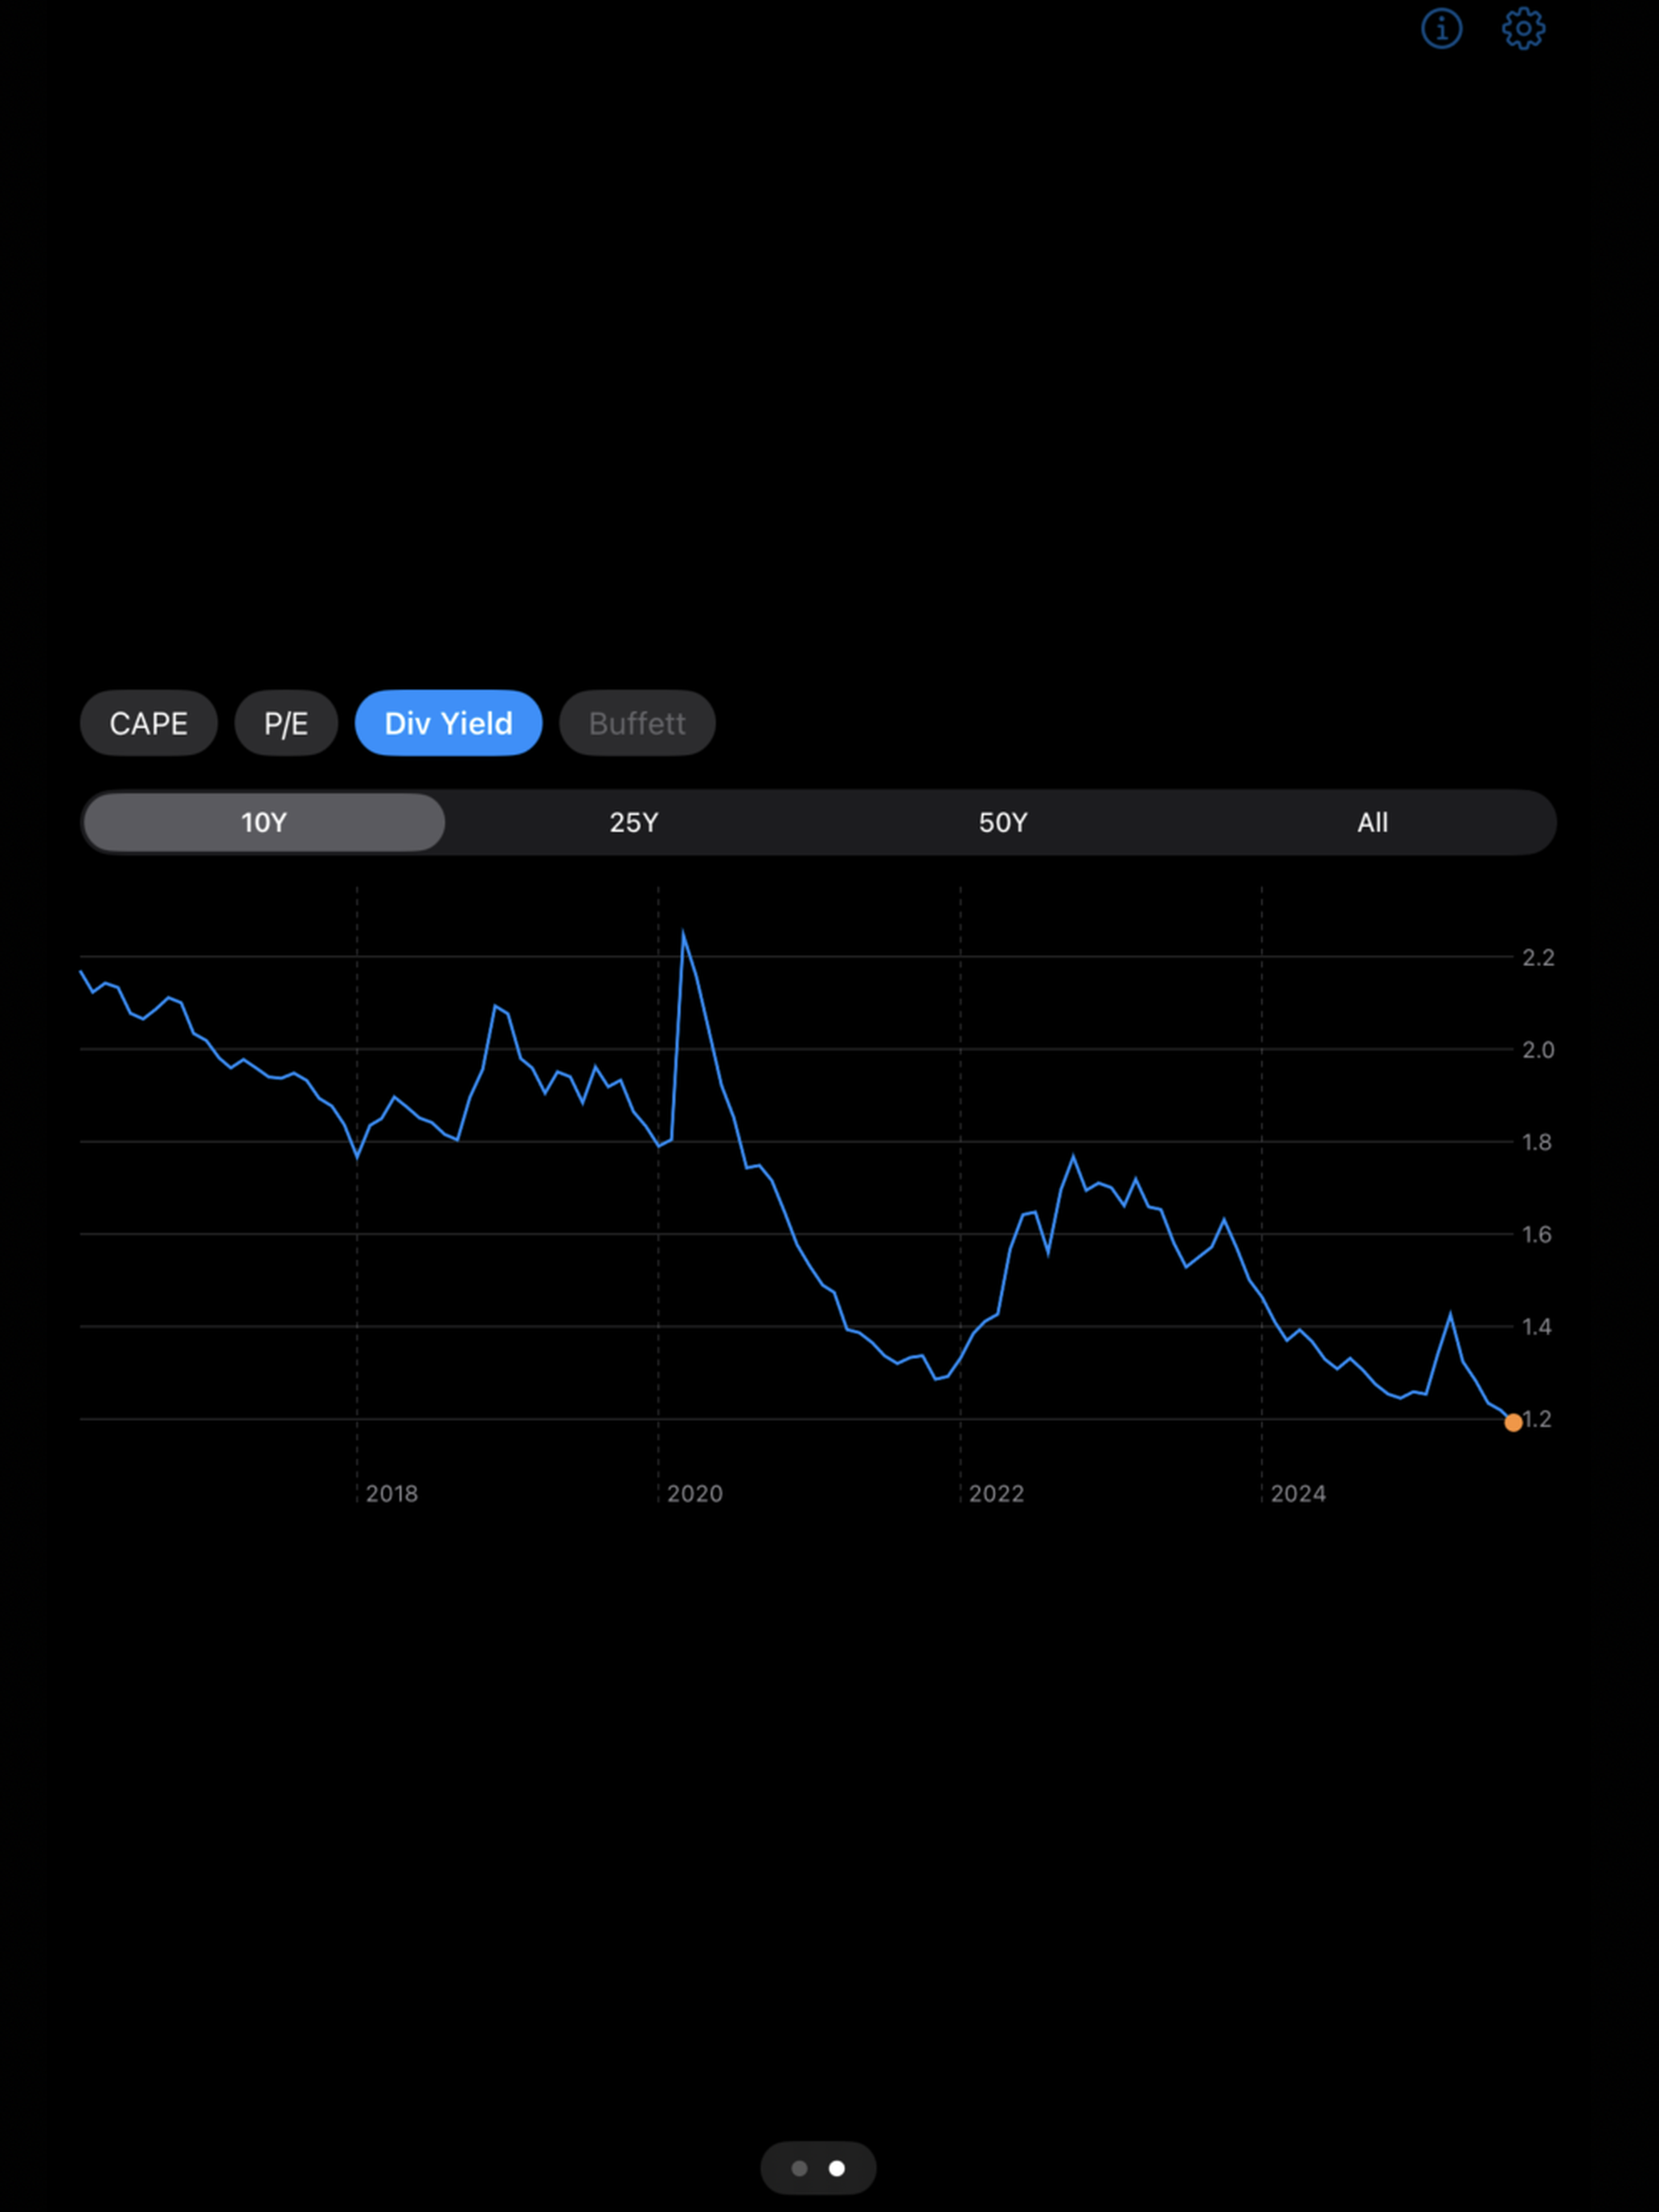
App
By:
Adam Nash
Version:
1.1 Last updated: 2026-03-14
Version code:
883376357
Creation date:
2026-03-02
Compatible devices:
Size:
1.04MB
URLs:
Privacy policy
Full description:
See detailed description
Source:
Apple Apps Store
Data ingested on:
2026-06-07
Compare stats and ranking:

Contact the developer

Chrome-Stats does not own this Apple app. Please use these information below to contact the Apple app developer.
Developed by:
Adam Nash
Apple Apps Store
https://apps.apple.com/hk/app/capedashboard/id6759525511?l=en-GB

Best CAPEDashboard Alternatives

Here are some Apple apps that are similar to CAPEDashboard: