Poster, Vision Board, Timeline
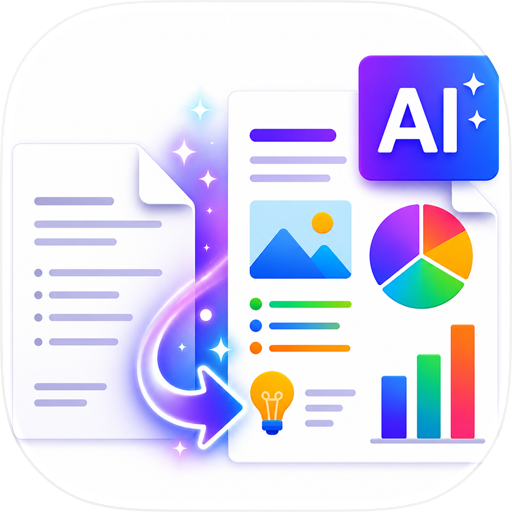
Turn text, PDFs, CSV data into stunning infographics instantly. Use AI Search to create visuals on any topic—no design skills needed. Professional results in seconds.
Transform any text into stunning infographics in seconds.
Vix AI is the ultimate infographic generator powered by artificial intelligence. Whether you have an article, a PDF document, raw data, or just a topic in mind—Vix AI transforms it into a beautiful, professional-quality visual ready to share anywhere.
Stop spending hours in complicated design software. With Vix AI, creating stunning infographics is as easy as typing a few words.
POWERFUL AI SEARCH FEATURE
Don't have content ready? No problem. Simply type any topic—from "benefits of meditation" to "climate change statistics"—and watch as our AI researches the subject, gathers relevant information, and automatically generates a comprehensive infographic.
Create informative visuals about virtually any subject without doing hours of research yourself. The AI finds accurate information and presents it in a visually appealing format perfect for learning, teaching, or sharing.
MULTIPLE INPUT OPTIONS
Text Input: Paste any article or written content. The AI identifies key points and structures them into a cohesive visual narrative.
PDF Import: Upload research papers or documents and let Vix AI extract important information into an easy-to-digest infographic.
CSV Data: Import spreadsheets and watch raw numbers become beautiful charts and data visualizations.
AI Topic Search: Enter any topic and let AI do the research—perfect for quick visuals on any subject.
PROFESSIONAL DESIGN WITHOUT EFFORT
Modern, clean aesthetics with balanced typography and visual hierarchy
Automatic layout optimization for maximum readability
Beautiful, harmonious color schemes
Consistent professional appearance across all visuals
HIGH-QUALITY EXPORTS
High-resolution output that looks perfect on any screen or print
Optimized for Instagram, Twitter, LinkedIn, and Pinterest
Presentation-ready for PowerPoint, Keynote, or Google Slides
Print quality maintained at any size
WHO IS VIX AI FOR?
Content Creators: Create eye-catching infographics that boost engagement
Marketers: Build compelling data visualizations in minutes
Students & Educators: Summarize complex topics into memorable visuals
Business Professionals: Transform reports into attention-grabbing graphics
Researchers: Present findings in accessible visual formats
Anyone who wants to explain ideas visually
WHY CHOOSE VIX AI?
Save hours of work—create in seconds what used to take hours
No design skills required—AI handles all design decisions
Always fresh content with AI Search on any topic
Privacy focused—your content is processed securely
Download Vix AI and experience the future of visual content creation. Whether you're summarizing reports, visualizing data, or exploring new topics—Vix AI makes it effortless.
Your ideas deserve to be seen. Make them visual with Vix AI.
Terms of Use (Apple EULA): https://vixai-infografik-web.netlify.app/terms
Privacy Policy: https://vixai-infografik-web.netlify.app/privacy
Chrome-Stats does not own this Apple app. Please use these information below to contact the Apple app developer.


 (0)
(0)