


Vendor Status Dashboard
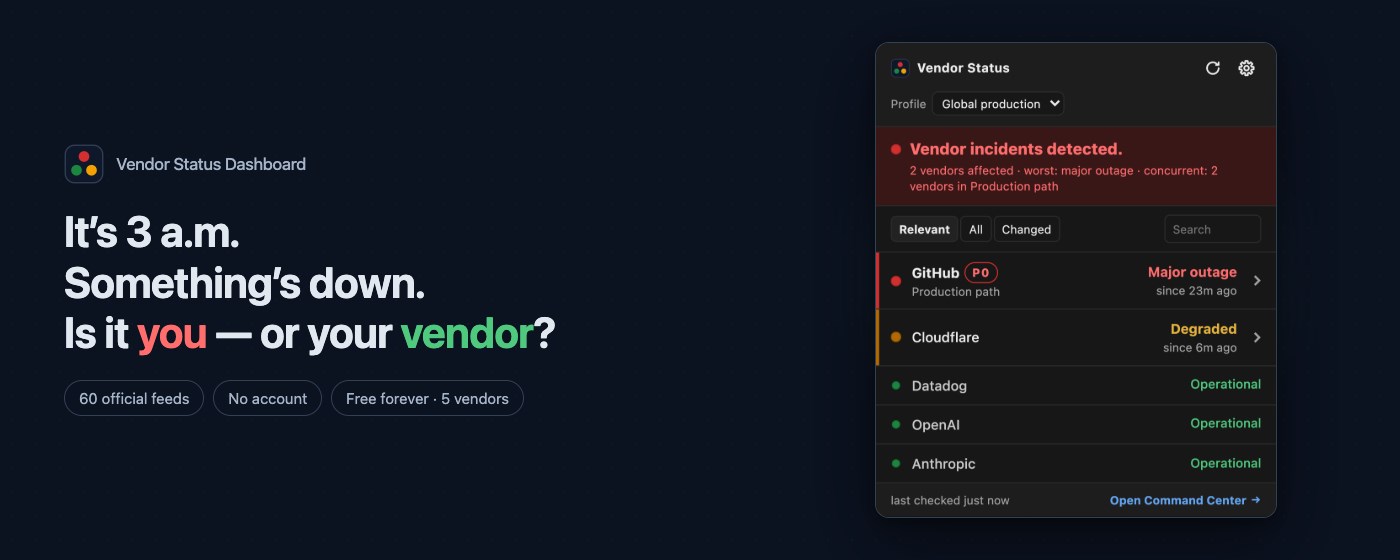
Monitor official vendor status pages, filter incidents by region, and triage outages in a local Microsoft Edge Side Panel.
 English
 Español
 Français
 Português
 日本語
日本語 简体中文
简体中文 한국인
한국인Overview
Features & Capabilities
User Growth & Download Statistics
Manifest V3 Add-on
- By:
- AppEvolve Labs
- Users:
- -
- Version:
- 0.5.10 Last updated: 2026-08-02
- Creation date:
- 2026-07-26

- Risk:
- Very high risk impact High risk likelihood
- Permissions:
- Host permissions:
- https://www.githubstatus.com/*
- https://status.datadoghq.com/*
- https://www.cloudflarestatus.com/*
- https://status.atlassian.com/*
- https://status.openai.com/*
- https://status.claude.com/*
- https://www.zoomstatus.com/*
- https://www.vercel-status.com/*
- https://status.twilio.com/*
- https://status.sentry.io/* See more
- https://www.githubstatus.com/*
- Size:
- 156.27KB
- URLs:
- Website ,Privacy policy
- Full description:
- See detailed description
- Source:
- Edge Add-on Store
- Data ingested on:
- 2026-08-03
- Compare stats and ranking:
- Vendor Status Dashboard vs Ecosystem Status Hub
- Vendor Status Dashboard vs Breakwater — API Change Monitor
- Vendor Status Dashboard vs Azure Status Checker
For Developers
Contact the developer
Chrome-Stats does not own this Edge add-on. Please use these information below to contact the Edge add-on developer.
Is Vendor Status Dashboard Safe?
Risk impact
Risk impact measures the level of extra permissions an extension has access to. A low risk impact extension cannot do much harms, whereas a high risk impact extension can do a lot of damage like stealing your password, bypassing your security settings, and accessing your personal data. High risk impact extensions are not necessarily malicious. However, if they do turn malicious, they can be very harmful.
Vendor Status Dashboard requires a lot of sensitive permissions. Exercise caution before installing.
Risk impact analysis details
- Critical Request access to the following domains: githubstatus.com, datadoghq.com, cloudflarestatus.com, atlassian.com, openai.com, claude.com, zoomstatus.com, vercel-status.com, twilio.com, sentry.io, polar.sh
- Medium ******* ******* ************* ***** *** ** ******* *** **** ******* ****** ******** *******
Risk likelihood
Risk likelihood measures the probability that an Edge add-on may turn malicious. This is determined by the publisher and the Edge add-on reputation on Edge Add-on Store, the amount of time the Edge add-on has been around, and other signals about the Edge add-on. Our algorithms are not perfect, and are subject to change as we discover new ways to detect malicious extensions. We recommend that you always exercise caution when installing an Edge add-on.
Vendor Status Dashboard is recently added, and hasn't been around long enough for us to gather enough data to accurately assess its risk level.
Risk likelihood analysis details
- High This extension was recently updated in the past month. New updates may not be stable or safe.
- High **** ********* *** ******** ****** *** ********** *** *** ** ****** ** *****
- High **** ********* *** *** **** ****** ********* ********** *** *** ** ****** ** *****

Extension Guard
Discover every extension in use, analyze risks, and enforce blocking policies with Extension Guard
Secure Your Browser Upgrade to see full risk analysis details
Promo Images
Best Vendor Status Dashboard Alternatives
Here are some Edge add-ons that are similar to Vendor Status Dashboard:

Ecosystem Status Hub
AI4Context
 - 0.00
  (0)
(0) 
Breakwater — API Change Monitor
AppEvolve Labs
- 0.00 (0) 
Azure Status Checker
Amit Lal
244 5.00 (2) 
Azure DevOps Status Monitor
Matt Booth
33 5.00 (1) 
PingPatrol - Outage Alerts & Service Status
dekacore
1 0.00 (0) 
Jira Dashboard for Edge
co10x
58 0.00 (0) 
MakerOps Radar
DevHexLab
1 5.00 (1) 
Repo Visualizer
Repo Visualizer
4 5.00 (1) 
WizExtend
Wiz Security
3K 0.00 (0) 
OTRS Monitor for Microsoft Edge
Mestrys
- 5.00 (1) 
Cloud Accountability Monitoring
Accountable Cloud Solutions
2 0.00 (0) 
D365 F&SCM StageSentinel – Environment Manager for D365 F&SCM
thees.io
17 0.00 (0)