Share Value Price Trend


Share Value Price Trend - Improve Share Trading and Investment Performance
Extension stats
Ranking
Other platforms
Extension summary
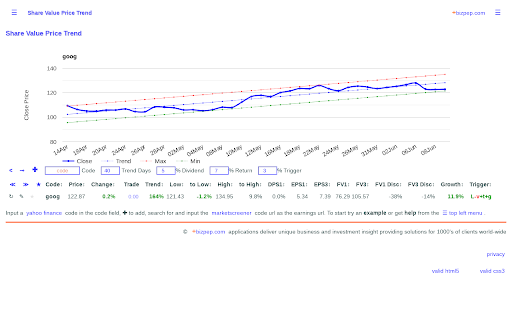
Share Value Price Trend provides unique insight to improve share trading and investment performance with share price fair value calculations for current and future years, share and index price trend analysis and high / low triggers to identify value buy / sell trade points. Share Value and Price Analysis provides further share value and price analysis detail.
It uses yahoo finance data for current and historical share prices and index levels. Estimated future share earnings (eps) and dividends (dps) from marketscreener are applied to identify future fair value share prices, current price discounts and dividend returns. This provides a basis for direct comparison of the future share price value.
Trend analysis is applied to historical share and index data to calculate trend range with high and low trend points, the trend days duration of trend analysis can be adjusted to review changing trends. Trade trigger points are identified using High / Low trend prices, estimated future value, annual trend slope and growth. Trade input for each code provides a record of target trades.
Data calculations include:
Indicative annual Trend % based on the historical close value over the Trend Days, positive Trend is green, negative Trend is red.
Trend High and Low values and % change from current. to Low% less than % Trigger are green indicating a buy level, to High% less than % Trigger are red indicating a sell level. On mouseover or click to Low and to High display the High or Low value.
Dividend per share % DPS for year 0 actual, and year 1 to year 3 estimates. When DPS % > % Dividend text is green.
Earnings per share EPS year 0 to year 3 are provided. On mouseover the payout ratio; the amount of earnings paid as dividends; and pe ratio are displayed.
See moreExtension safety
Risk impact

Share Value Price Trend does not require any sensitive permissions.
Risk likelihood
Share Value Price Trend has earned a fairly good reputation and likely can be trusted.
Promo images

Similar extensions
Here are some Chrome extensions that are similar to Share Value Price Trend:


