

Vernier Graphical Analysis
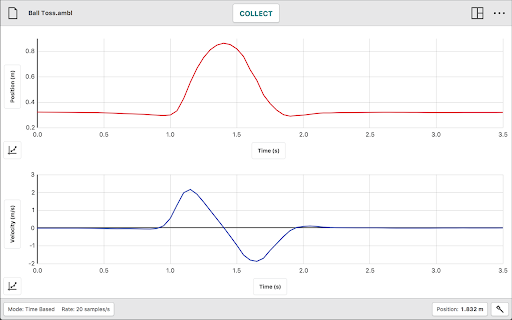
Graphical Analysis™ is a tool for science students to collect, graph, and analyze data from Vernier sensors.
What is Vernier Graphical Analysis?

Stats
- storage
- power
- system.memory
- mdns
- clipboardWrite
- clipboardRead
- http://*/*
- https://*.execute-api.us-west-2.amazonaws.com/*
- notifications
- {"fileSystem":["write","retainEntries","directory"]} See more
Chrome-Stats Rank
Other platforms

Summary
Graphical Analysis™ is a tool for science students to collect, graph, and analyze data from Vernier sensors.
New this release: • [NEW] Rename Data Set in Y Axis popup • [PRO] Manual curve fits with draggable lines • [PRO] Notes field • [FIX] Savitzky-Golay smoothing functions
Sensor data-collection support: • Vernier Go Direct® sensors - with Bluetooth® wireless technology and USB connectivity • Vernier Go Wireless® Heart Rate and Go Wireless Exercise Heart Rate monitors • Vernier LabQuest® sensors used with LabQuest 3, LabQuest 2, LabQuest Stream, LabQuest Mini, or Go!Link® interfaces • Vernier Go!Temp® and Go!Motion® USB sensors
Additional experiment options:
User reviews
Safety
Risk impact
Vernier Graphical Analysis is risky to use as it requires a number of sensitive permissions that can potentially harm your browser and steal your data. Exercise caution when installing this extension. Review carefully before installing. We recommend that you only install Vernier Graphical Analysis if you trust the publisher.
Risk likelihood
Vernier Graphical Analysis may not be trust-worthy. Avoid installing if possible unless you really trust this publisher.
Screenshots


Promo images
