GitHub-Chart
Renders an new face for GitHub Contribution Graphs.


What is GitHub-Chart?
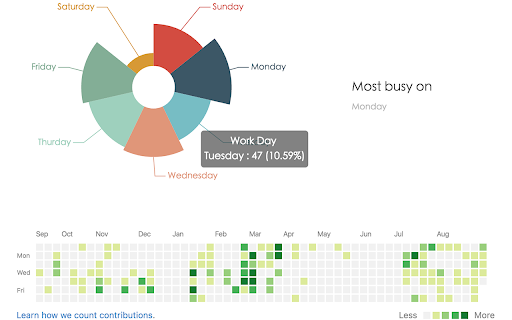
GitHub-Chart is a Chrome extension designed for Github users. It offers a new perspective to your repository contributions by replacing the conventional contribution graphs with Bar and Pie graphs. This makes the commit data more visually appealing and easier to comprehend. Enhance your experience and understanding of your contribution patterns on GitHub with GitHub-Chart.
Stats
By: pdd
Rating: 4.89
(9)
Creation date: 2016-10-20
Risk impact: Low risk impact
Risk likelihood: Low risk likelihood
Manifest version: 2
Permissions:
- storage
Size: 257.02K
Email: yw*****@gmail.com
Stats date:
Chrome-Stats Rank
Other platforms
Not available on Firefox
Not available on Edge
Want to check extension ranking and stats more quickly for other Chrome extensions?
Install
Chrome-Stats extension
to view Chrome-Stats data as you browse the Chrome Web Store.

Summary
An extension for Github Users. It renders an Bar graphs & Pie graphs to show your commits better.
User reviews
切换年份 图标消失
by  漠然, 2016-09-24
very good!!!
by  xin zheng, 2016-07-07
Safety
Risk impact
GitHub-Chart is relatively safe to use as it requires very minimum permissions.
Risk likelihood
GitHub-Chart has earned a fairly good reputation and likely can be trusted.
Upgrade to see risk analysis details
Promo images

Similar extensions
Here are some Chrome extensions that are similar to GitHub-Chart: