Jira Metrics Plugin
This extension provides simple graphs based on Jira column data, featuring lead time and predictability charts.


Stats
- tabs
- storage
Chrome-Stats Rank
Other platforms

Summary
Maximize your team's efficiency with the Jira Metrics Plugin, an indispensable tool for delivery managers and teams using Jira for project management. Dive deep into your project's workflow with features specifically designed to enhance your productivity and decision-making.
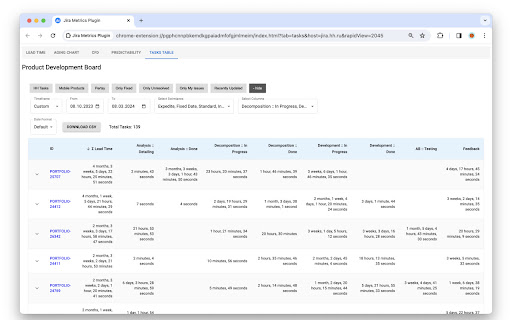
To get started, simply click the "Analyze Metrics" button, which can be found on your Kanban board in Jira.
Key Features:
Advanced Analytics: Elevate your workflow analysis with the ability to pinpoint bottlenecks and enhance efficiencies using data. The plugin allows you to filter data by swimlanes, board columns, and custom filters derived from your Kanban board, empowering you to discover and address specific areas for improvement.
Cycle Time Histogram: Also known as the Lead Time Distribution Chart (LTDC), this spectral distribution diagram displays the time spent on completed tasks. It provides a visual representation to help predict the likelihood of similar tasks being completed within specific timelines, enabling more accurate forecasting and planning.
Aging Chart: Visualize the duration that tasks have been pending in specific stages with the Aging Chart. This chart helps you quickly identify and prioritize tasks that require immediate attention, reducing the risk of delays and improving cycle times.
Cumulative Flow Diagram: Gain insights into the overall flow of your work with our Cumulative Flow Diagram. Track the accumulation of tasks across stages, helping you identify trends and areas for optimization.
Predictability Charts: Plan with confidence using our predictability charts. They offer a visual representation of your team's performance over time, allowing you to foresee future trends and prepare accordingly.
User reviews
Safety
Risk impact
Jira Metrics Plugin may not be safe to use and it requires some risky permissions. Exercise caution when installing this extension. Review carefully before installing.
Risk likelihood
Jira Metrics Plugin is probably trust-worthy. Prefer other publishers if available. Exercise caution when installing this extension.
Similar extensions
Here are some Chrome extensions that are similar to Jira Metrics Plugin: